Microsoft Excel features calculation, graphing tools, pivot tables, and a macro programming language. It’s an unavoidable piece of software that all students – from teenagers to college students – should learn. Below are five really basic things you can do with Microsoft Excel.
Macros are Great for Repeated Tasks
If you have tasks in Microsoft Excel that you do repeatedly, you can record a macro to automate those tasks. A macro is an action or a set of actions that you can run as many times as you want. When you create a macro, you are recording your mouse clicks and keystrokes. After you create a macro, you can edit it to make minor changes to the way it works.
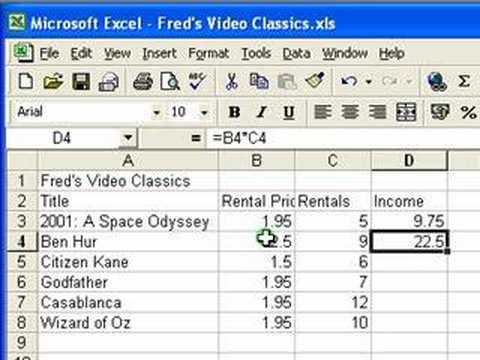
Formulas are the “magic” in Excel
If you’re new to Excel, you’ll soon find that it’s more than just a grid in which you enter numbers in columns or rows. Yes, you can use Excel to find totals for a column or row of numbers, but you can also calculate a mortgage payment, solve math or engineering problems, or find a best case scenario based on variable numbers that you plug in.
Charts for a Visual Display of Data
Charts are used to display series of numeric data in a graphical format to make it easier to understand large quantities of data and the relationship between different series of data. Excel supports many types of charts to help you display data in ways that are meaningful to your audience.
- Column charts
- Line charts
- Pie charts
- Bar charts
- Area charts
- XY (scatter) charts
- Stock charts
- Surface charts
- Doughnut charts
- Bubble charts
- Radar charts
PivotTables and PivotCharts are Great for Exploring Data
A PivotTable report is useful to summarize, analyze, explore, and present summary data. A PivotChart report can help you visualize PivotTable report summary data so that you can easily see comparisons, patterns, and trends. Both reports enable you to make informed decisions about critical data in your enterprise.
Conditional Formatting is Great for Visual Affects
Conditional formatting helps you visually answer specific questions about your data by making it easy to highlight interesting cells or ranges of cells, emphasize unusual values, and visualize data by using data bars, color scales, and icon sets. A conditional format changes the appearance of a cell range based on conditions (or criteria).
This is just the tip of the ice berg for what you can do with Excel. Excel is a must-learn for any student. Whether in high school or college courses, Excel will be used in a variety of classes; not just math. Students will also come across it in both annoying part time jobs to the “bigtime” ones sought after college graduation. Do yourself a favor and begin learning Excel now. You can go the DIY route and just learn as you go or if you are serious about mastering it, then you may want to consider an Excel consultant to help train you on the ins and outs and how Excel can help you various settings.